Measuring progress on your data maturity journey

It is easy to get off track in the Brecon Beacons
This post is about why you should keep checking your data maturity. We will get into that but, first, indulge me in a short analogy.
Check the map
I enjoy walking in the Brecon Beacons.
One thing I've learned (the hard way) is you need a map.
Not only do you need a map but you need to keep checking it.
If you check the map regularly, you can either be reassured that you are where you expected to be, or you can find out rapidly that you are moving off track and get yourself back on the route quickly.
These days GPS makes it easier to check the map. But it doesn't eliminate the need to keep checking.
Check the Framework
We have our own equivalent of the map. The Data Maturity Framework. It was developed with nonprofits and has been used by thousands of people in nonprofit and public sector organisations. Locating your organisation on the Data Maturity Framework is the basis of developing a data strategy and starting the journey to improving data in your organisation.
The Data Maturity Assessment Tool
We even have our own equivalent of GPS to make it easy to locate yourself on the Framework. Our Data Maturity Assessment tool works for every organisation, from the very small to the very large. It gives you a score for each of the seven themes of Data Maturity and an overall score.
Our recent Impact Evaluation showed that a Data Maturity Assessment has direct benefits for organisations. It prompts sharing and discussions about data within organisations. It is associated with securing financial resources to implement improvements. And around 40% of organisations go on to implement a data strategy (though the % is much higher for organisations that invest in an organisational assessment).
Keep checking
Repeat Data Maturity Assessments help keep organisations on track for improvement. Just like regularly checking a map in the mountains keeps hikers on the right path.
The Cart Shed is a medium-sized charity based in rural Herefordshire. Its staff and volunteers use woodland and horticulture activities to empower people to self-manage their mental and physical health in sustainable ways.
They have undertaken five Data Maturity Assessments since 2018. Looking at the scores side by side it is clear to see that their improvement journey has not been a smooth, linear progression.
Cart Shed overall data maturity scores 2018-2022

n = Number of people who took the assessment
The chart shows a year-on-year increase in data maturity from 2018 to 2020. Then a reduction in data maturity in 2021. In 2022, data maturity improves again. Data maturity in 2022 is higher than in any of the previous years.
Katie Eastaugh, Chief Executive of the Cart Shed told us:
“For the first assessment, we probably thought we were doing better than we were. It’s very similar to our clients, who have become very used to masking their mental health issues when they first come to us. When we see their scores drop, we actually see this as a good thing, because they’re starting to be more honest about how they’re doing. Similarly, as we started to grow our knowledge and understanding of data maturity, we had a different assessment of where we were.”
Improving data maturity has real impacts in the organisation. The Cart Shed saw a significant increase in the influence data and analytics has on areas - such as targeting services and interventions to clients and measuring client outcomes - in 2022, compared to 2020.
You can read more about the Card Shed and their improvement journey in our article Reflections on The Cart Shed's 4-year data maturity journey.
Evidencing the impact of support
Another area where repeat assessments are really valuable is when organisations join a programme to get support with data and analysis. One such programme is Datawise in London.
In June 2021 a group of charities completed a 10-month cohort support programme delivered by Superhighways and a group of data mentors.
Each charity took a Data Maturity Assessment at the start and at the end of the programme. The programme used the initial data maturity scores to prioritise and tailor some of the support in the programme.
Almost all of the organisations in the cohort saw a noticeable improvement in data maturity between the two assessments
Change in Datawise Cohort Data Maturity Scores
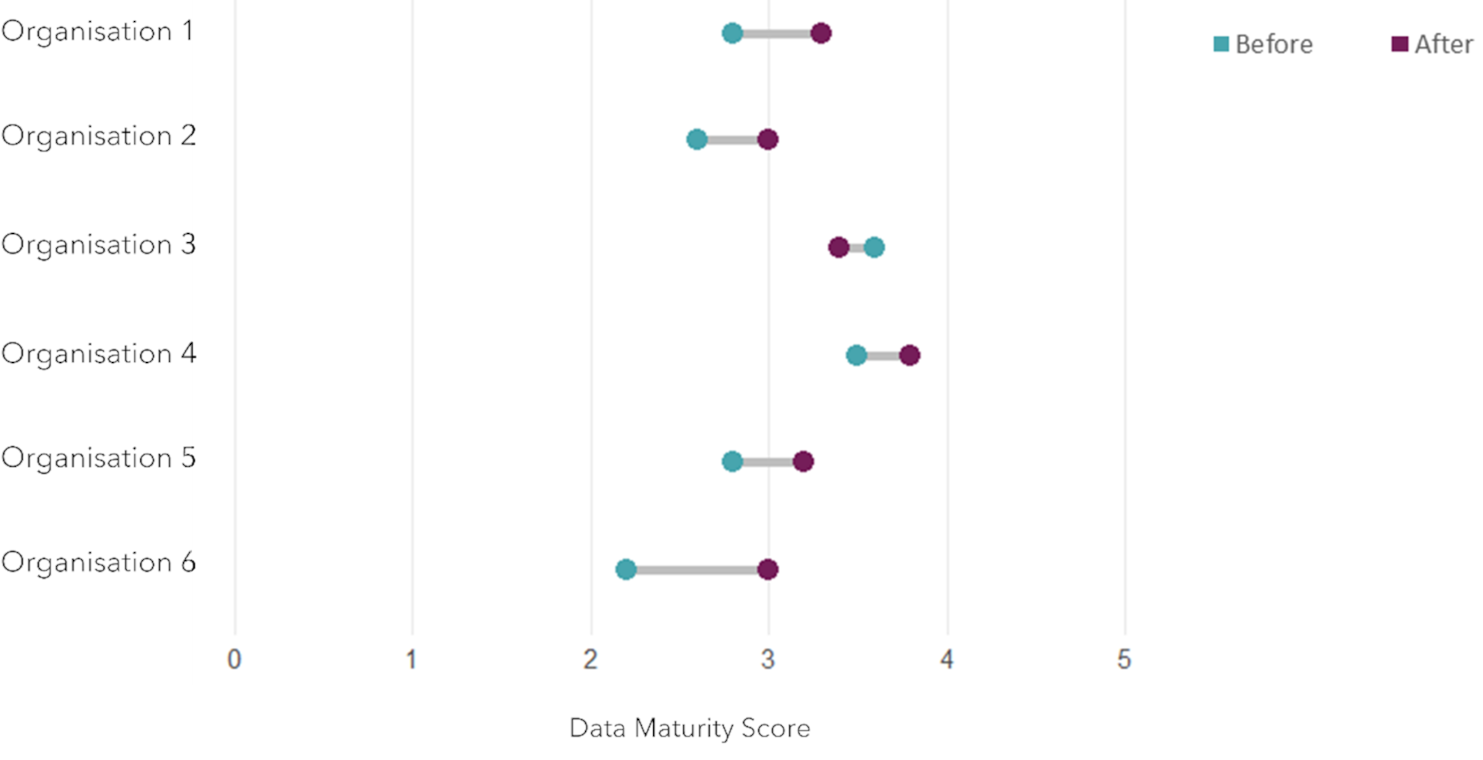
All but one of the organisations showed an increase in data maturity score. Organisation 3, which had the highest data maturity score at the start of the programme, saw its data maturity score lower slightly.
Kate White, Manager of Superhighways, told us:
“It’s been particularly valuable for us to use an existing assessment, linked to an established framework, as this places our cohort programme within a wider context of data maturity in the social sector."
You can read more about this project in our article Advancing data maturity in a cohort of organisations
Don’t drift off course
Our Data Maturity Assessment tool makes checking where you are in terms of data maturity really simple. For small organisations it is even free.
It is really useful to take an assessment at the start of your journey but, unless you plan to take further assessments, you risk drifting of course without realising it.
We know from our Impact Report that, following a data maturity assessment, many organisations have gone on to invest in new roles and responsibilities, better tools and training. A repeat assessment would be an excellent way to check to see if that effort has paid off.
If you would like to organise repeat assessments to measure your progress, please get in touch with us now.