A new improved Data Maturity Assessment
All Snazzed Up - the fresh, smart redesigned Data Maturity Assessment
Since we launched the first free Data Maturity Assessment and benchmarking tool in 2019, we’ve been on a journey of relentless improvement and innovation. In 2020 we launched the Organisation product, this was followed, in 2021, by the Cohort tool designed for multiple organisations, and in 2024 we successfully tested a new assessment for networks and membership organisations (more on that soon).
In fact, we’re now on version 23 of our assessment and benchmarking tool, and the third version of our underlying framework model. So we thought you might be interested to know a bit about some of the latest improvements we’ve made to the tool itself and the reports you get when you complete an assessment. Let us take you through some of the latest changes.

Improved accessibility
We’ve redesigned the look and layout of the whole Data Maturity Assessment to improve accessibility. It is now fully WCAG compliant to AA level. All the pages and reports now look much cleaner and clearer and there’s also a much better experience for mobile users.
Easier to understand at a glance
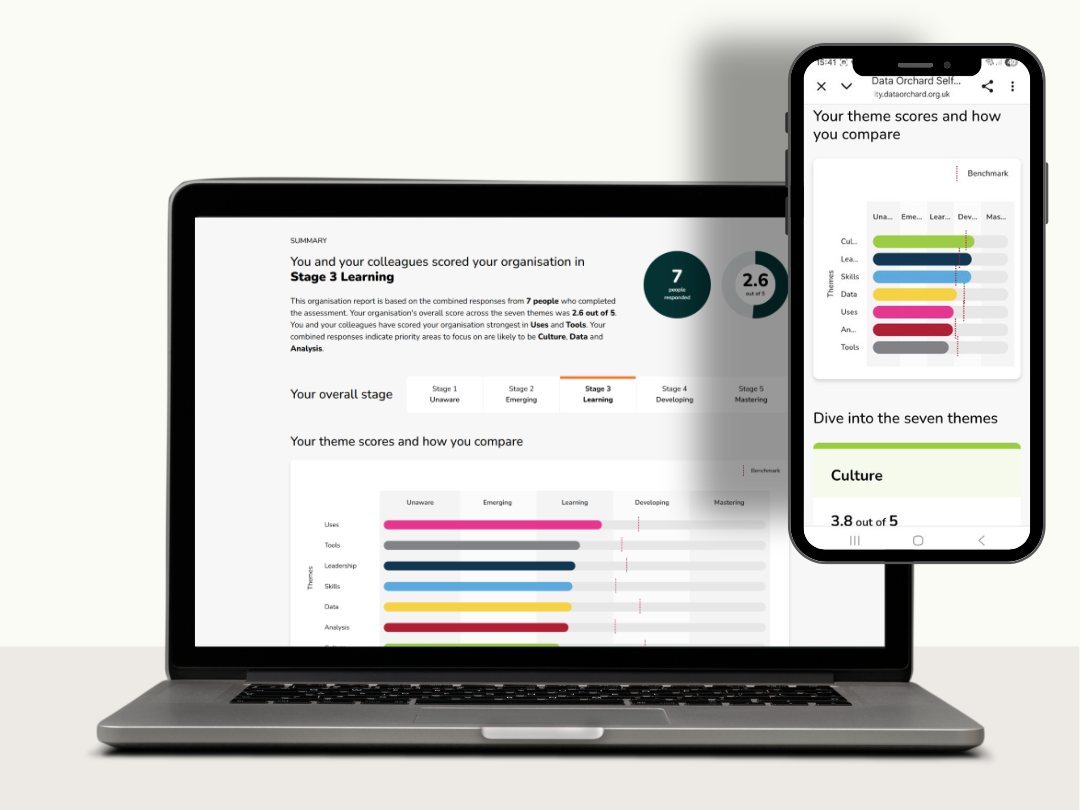
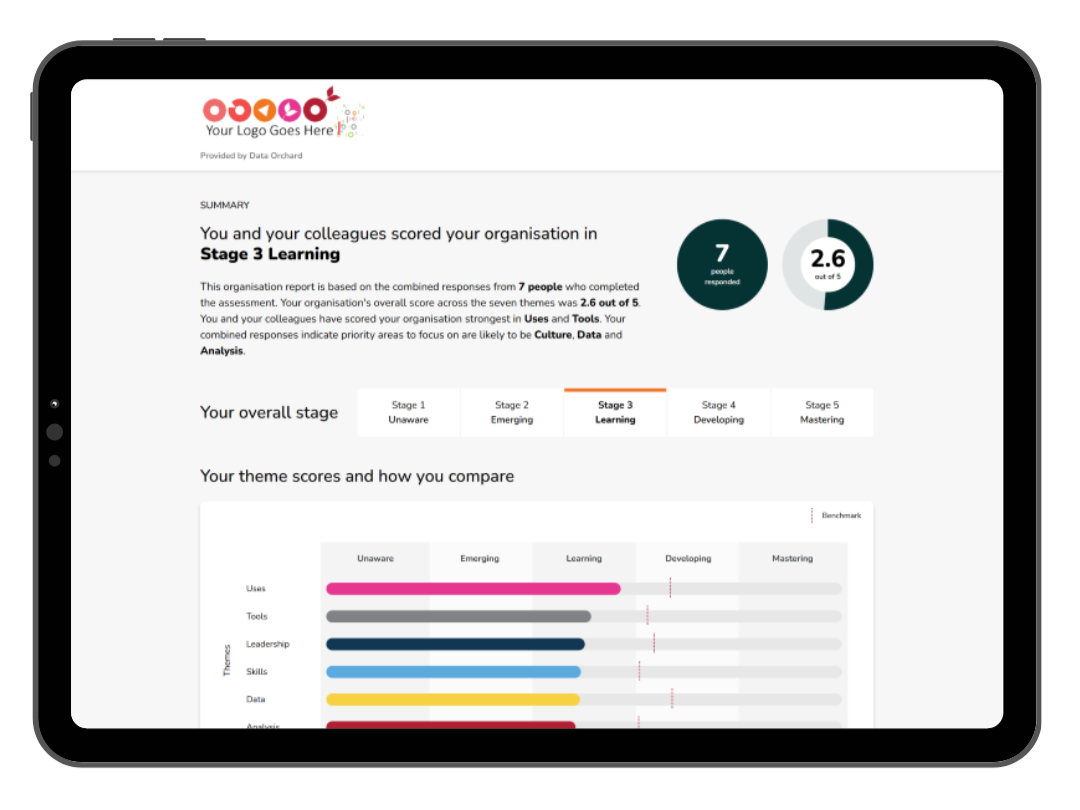
We’ve refreshed the report you get when you complete the assessment to make the content easier to digest, highlighting key information.
For example we’ve added a new overall stage summary and a bold circle which shows at a glance how you scored your organisation. You’ll see this new icon in other parts of the reports too.

Highlighting strengths and areas for improvement
As well as providing your overall data maturity score, you’ll also get a score for each of the seven key themes. These are now displayed in order, showing your strongest scores first.
You can then dive into the detail for each of the themes and easily explore the suggested priority areas for action.

New look in-depth theme report pages
For each of the seven themes, you can click through to an in-depth report page. These pages also have a fresh design, with the new bold score circles showing your score for that theme, alongside the average score for users in the benchmark group. The summary graph has also been refreshed to further help you understand how you scored your organisation compared to others.
Improvements to our Organisation reports
If you are using the Organisation Data Maturity Assessment tool, each member of staff will get a customised user experience and receive their own report showing how they personally scored the organisation.
Meanwhile you (the organisation lead) will get a report combining responses from all the members of staff participating in the assessment, providing a more balanced and representative view. You’ll also get a supplementary treasure trove of custom internal and external benchmarking based on the very latest validated benchmarks for your sector and sub-sector.
Dynamic respondent count
When conducting an organisation-wide assessment it’s vital to maximise staff or member engagement so your results are balanced and representative. With our tried and tested approach many organisations achieve staff response rates of 80 to 100%!
Our organisation reports now include an additional ‘count’ circle showing the total number of respondents (which will update dynamically as long as the assessment window is open).
This new feature will bring you daily joy as you watch the numbers of respondents go up and your organisation scores become more accurate and robust.
Explore our interactive sample reports here
Individual reports (free)
If you complete a free Data Maturity Assessment you’ll receive a report scoring your responses. A link to this report is also sent to your email so you can revisit it at any time. Explore a sample individual report.Organisation reports
When your organisation takes part in an Organisation Data Maturity Assessment (our paid version) each person who contributes to the assessment receives their own individual report, and the project lead also receives an organisation report which combines all of the responses. Explore a sample organisation report
For both versions don’t forget to click through to the explanation of data maturity stages and the different indepth theme reports.
What next?
New to our Data Maturity Assessment? Try our free version to score your own organisation’s data maturity.
Time for a repeat assessment? If you’re one of the 15,000+ people who’ve already used our Data Maturity Assessment, maybe now would be a good time to take a repeat assessment and see how things have changed. Explore your options
Take the next step. Thinking about how your organisation could benefit from an organisation-wide assessment? Explore options and pricing for using our Organisation Data Maturity Assessment tool and read examples of how other organisations have used the tool to support their journey to improving with data.