State of the Sector
Data Maturity In the Not-for-Profit Sector, 2021 Report
Written and researched by Sian Basker and Matthew Gosling, September 2022
Download the pdf, or read the online version below.

Written and researched by Sian Basker and Matthew Gosling, September 2022
Download the pdf, or read the online version below.
1.1 What is data maturity?
1.2 Scoring and benchmarking
2. About the data in this report
2.1 Individual and multiple users
2.2 The taster assessment
2.3 Cleaning and validation
2.4 Organisation versus respondent level analysis
2.5 Defining the not-for-profit sector
2.6 Important terminology
3. Profile and characteristics of users
3.1 About all the organisations using the tool
3.2 About the not-for-profit organisations using the tool
3.3 About the people using the tool
4. Overall findings about data maturity
4.1 How data mature is the not-for-profit sector?
4.2 How does data maturity compare across sectors and sub-sectors?
4.3 Strengths and weaknesses
4.4 Relationships between the seven themes
4.5 Staff time spent on data as organisations mature
4.6 Organisation income as an indicator of data maturity
4.7 Comparing 2021 results with 2020
5.1 Uses
5.2 Data
5.3 Analysis
5.4 Leadership
5.5 Culture
5.6 Tools
5.7 Skills
6.1 Key insights
6.2 Reflections
6.3 What needs to happen now?
6.4 Achievements over the last year
6.5 Plans for next year
6.6 How you can contribute to next year's results
Annex 1: Detailed analysis by key theme
Annex 2: Sector categorisation by legal type
Annex 3: Rewards and benefits by data maturity stage
Annex 4: Correlations between themes
Annex 5: Analysis of data maturity by income level
Our thanks to all the users of our Data Maturity Assessment tool (both the free individual version and premium organisational version) for agreeing to share your organisation’s data for the benefit of research and understanding about data maturity in the not-for-profit sector.
Appreciation also to the many users who have shared their organisations’ journeys towards data maturity and contributed to our tools and resources for the sector.
Data maturity is the organisational journey towards improvement and increased capability in using data. Data Orchard created a framework model which describes data maturity on a five-stage journey. This progresses from ‘Unaware’ through to ‘Mastering’ across seven key themes: Uses, Data, Analysis, Leadership, Culture, Tools, and Skills.
In October 2019 we launched an online Data Maturity Assessment tool which enables organisations to measure where they are on the five-stage journey to data maturity. The free version for individual users was followed in 2020 by the premium version, which is designed for multiple users within an organisation. Our first report shared what the data from 2019 and 2020 told us about data maturity in the not-for-profit sector. This report focuses on users in 2021.
Data Orchard’s Data Maturity Assessment tool has been used by thousands of people from all kinds of organisations and sectors, and from all over the world. This report focuses only on data from validated non-commercial organisations who used the tool between 1 January and 31 December 2021: a total of 937 respondents from 162 organisations.
For the purposes of this report, we defined the not-for-profit sector to essentially mean non-commercial organisations, including non-governmental organisations like charities and social enterprises, public sector organisations, and universities.
Those organisations:
operate in a broad range of activity areas, with highest numbers in health, social services, local government, and education.
primarily come from the UK (including representation from every UK nation and region), but there were also users from over 30 countries around the world.
vary in size and turnover, with income ranging from less than £100k to more than £100m.
The people completing the assessment on behalf of their organisation work in many different roles. The most common job roles are ‘strategy/planning’ and ‘leadership and management’. There were also many respondents in data management and analysis roles, and in service delivery roles.
Based on the analysis on overall data maturity and exploration of the seven key themes, we have drawn seven key insights from this research. These are:
2021 data shows most not-for-profit organisations to be at the ‘Learning’ stage (50%) in their journey to data maturity. A good proportion have progressed into ‘Developing’ (37%), though barely any have made it to the ‘Mastering’ stage. Around one in ten are still lagging in the ‘Emerging’ stage (11%). Average (median) scores for all the key themes (Uses, Data, Analysis, Leadership, Culture, Tools, and Skills) were all in the ‘Learning’ stage, ranging from 2.66 to 2.91 out of 5.
Skills is the weakest area for not-for-profits. The range of skills, knowledge and experience around data and analytics, and the types of roles and responsibilities are many and varied. A major obstacle is people not knowing what skills and capabilities they need, nor where they can access trustworthy advice and support.
While almost all organisations say their leadership think data is important, just 6% think leaders actually prioritise data as a vital resource and understand how to use it. Organisations have lots of data, but only 2% feel their leadership are actually using that data to make data-informed decision. This could be due to a lack of data skills in leadership teams – many (53%) say that there is no one with data analytics expertise within their leadership. It may also be due to barriers accessing meaningful insights from disparate data sources.
Our research has repeatedly found that all seven key themes have a positive correlation with an organisation’s data maturity. But, some relationships are stronger than others. The strongest and most significant correlations all involve the culture of an organisation – issues around behaviours, policies and practices, relating to team approach, self-questioning, openness and protection. The weakest correlations all involve tools. So, while databases and relationship management systems are important for holding data, organisations that really want to advance their data maturity would do well to focus on their culture first.
Staff spend a lot of time working with data, whatever the data maturity of the organisation, suggesting the hidden cost of data is high for all organisations. Organisations that are less data mature, however, see very little reward for all this time and effort. As data maturity advances, organisations do invest more time in data, but proportionally, the rewards and benefits grow at a much faster rate. For example, compared to an organisation at ‘Learning’ stage, a ‘Developing’ organisation increases its average time spent on data by 7%, but increases its ability to use data to evidence the need and problems they are addressing by almost 30%.
Organisations with greater income are not inherently more data mature than those with lower incomes. However, those that invest in data related resources i.e. people, skills, training, and tools, are more advanced.
Much was made of the need to digitise during the pandemic but, while some gains have been made, in many cases there hasn’t been as much progress as you might think. A lot of data is still on paper (40% collect data on paper moderately or extensively - 14% less than in 2020, but still a high proportion). When it comes to tools for analysing and reporting data, spreadsheets still dominate, but databases and CRMs are fairly common (60%). Business intelligence tools are used by 30%, and 20% are using more advanced and specialist data science tools (up from 15% in 2020).
Results for data maturity assessments in 2021 compared with 2020 shows there’s little difference in the scores. This is positive in that it confirms and validates the findings in our previous analysis and means we can be more confident in how authoritatively the results describe the reality of data maturity in the not-for-profit sector.
We encourage policy makers, leaders, and decision makers with an interest in strengthening the sector to invest more in building the knowledge and skills to advance data maturity. There’s a need for more data career and learning pathways in education and training spheres.
Data Orchard has been researching data maturity since 2015. We define data maturity as an organisation’s journey towards improvement and increased capability in using data. You can read a brief history of our work on Data Maturity here.
In October 2019 we launched an online Data Maturity Assessment tool which enables organisations to measure where they are on the five-stage journey to data maturity. The free version for individual users was followed in 2020 by the premium version, which is designed for multiple users within an organisation. Our first report shared what the data from 2019 and 2020 told us about data maturity in the not-for-profit sector. This report focuses on users in 2021.
To provide an organisation level analysis we have matched multiple respondents to organisations and calculated organisation data maturity scores from there. We have also been through a validation process to ensure our analysis only focuses on the results for organisations that legitimately exist and are from non-commercial sectors. Hence from our initial dataset of 1,221 respondents, matched to 369 organisations, we extracted 937 responses from 162 not-for-profit organisations.
We define the not-for-profit sector as non-commercial organisations. In this research we include non-governmental organisations, public sector organisations, and universities (see Annex 2 for details of how we categorise organisations).
Data maturity is defined as the journey towards improvement and increased capability in using data.
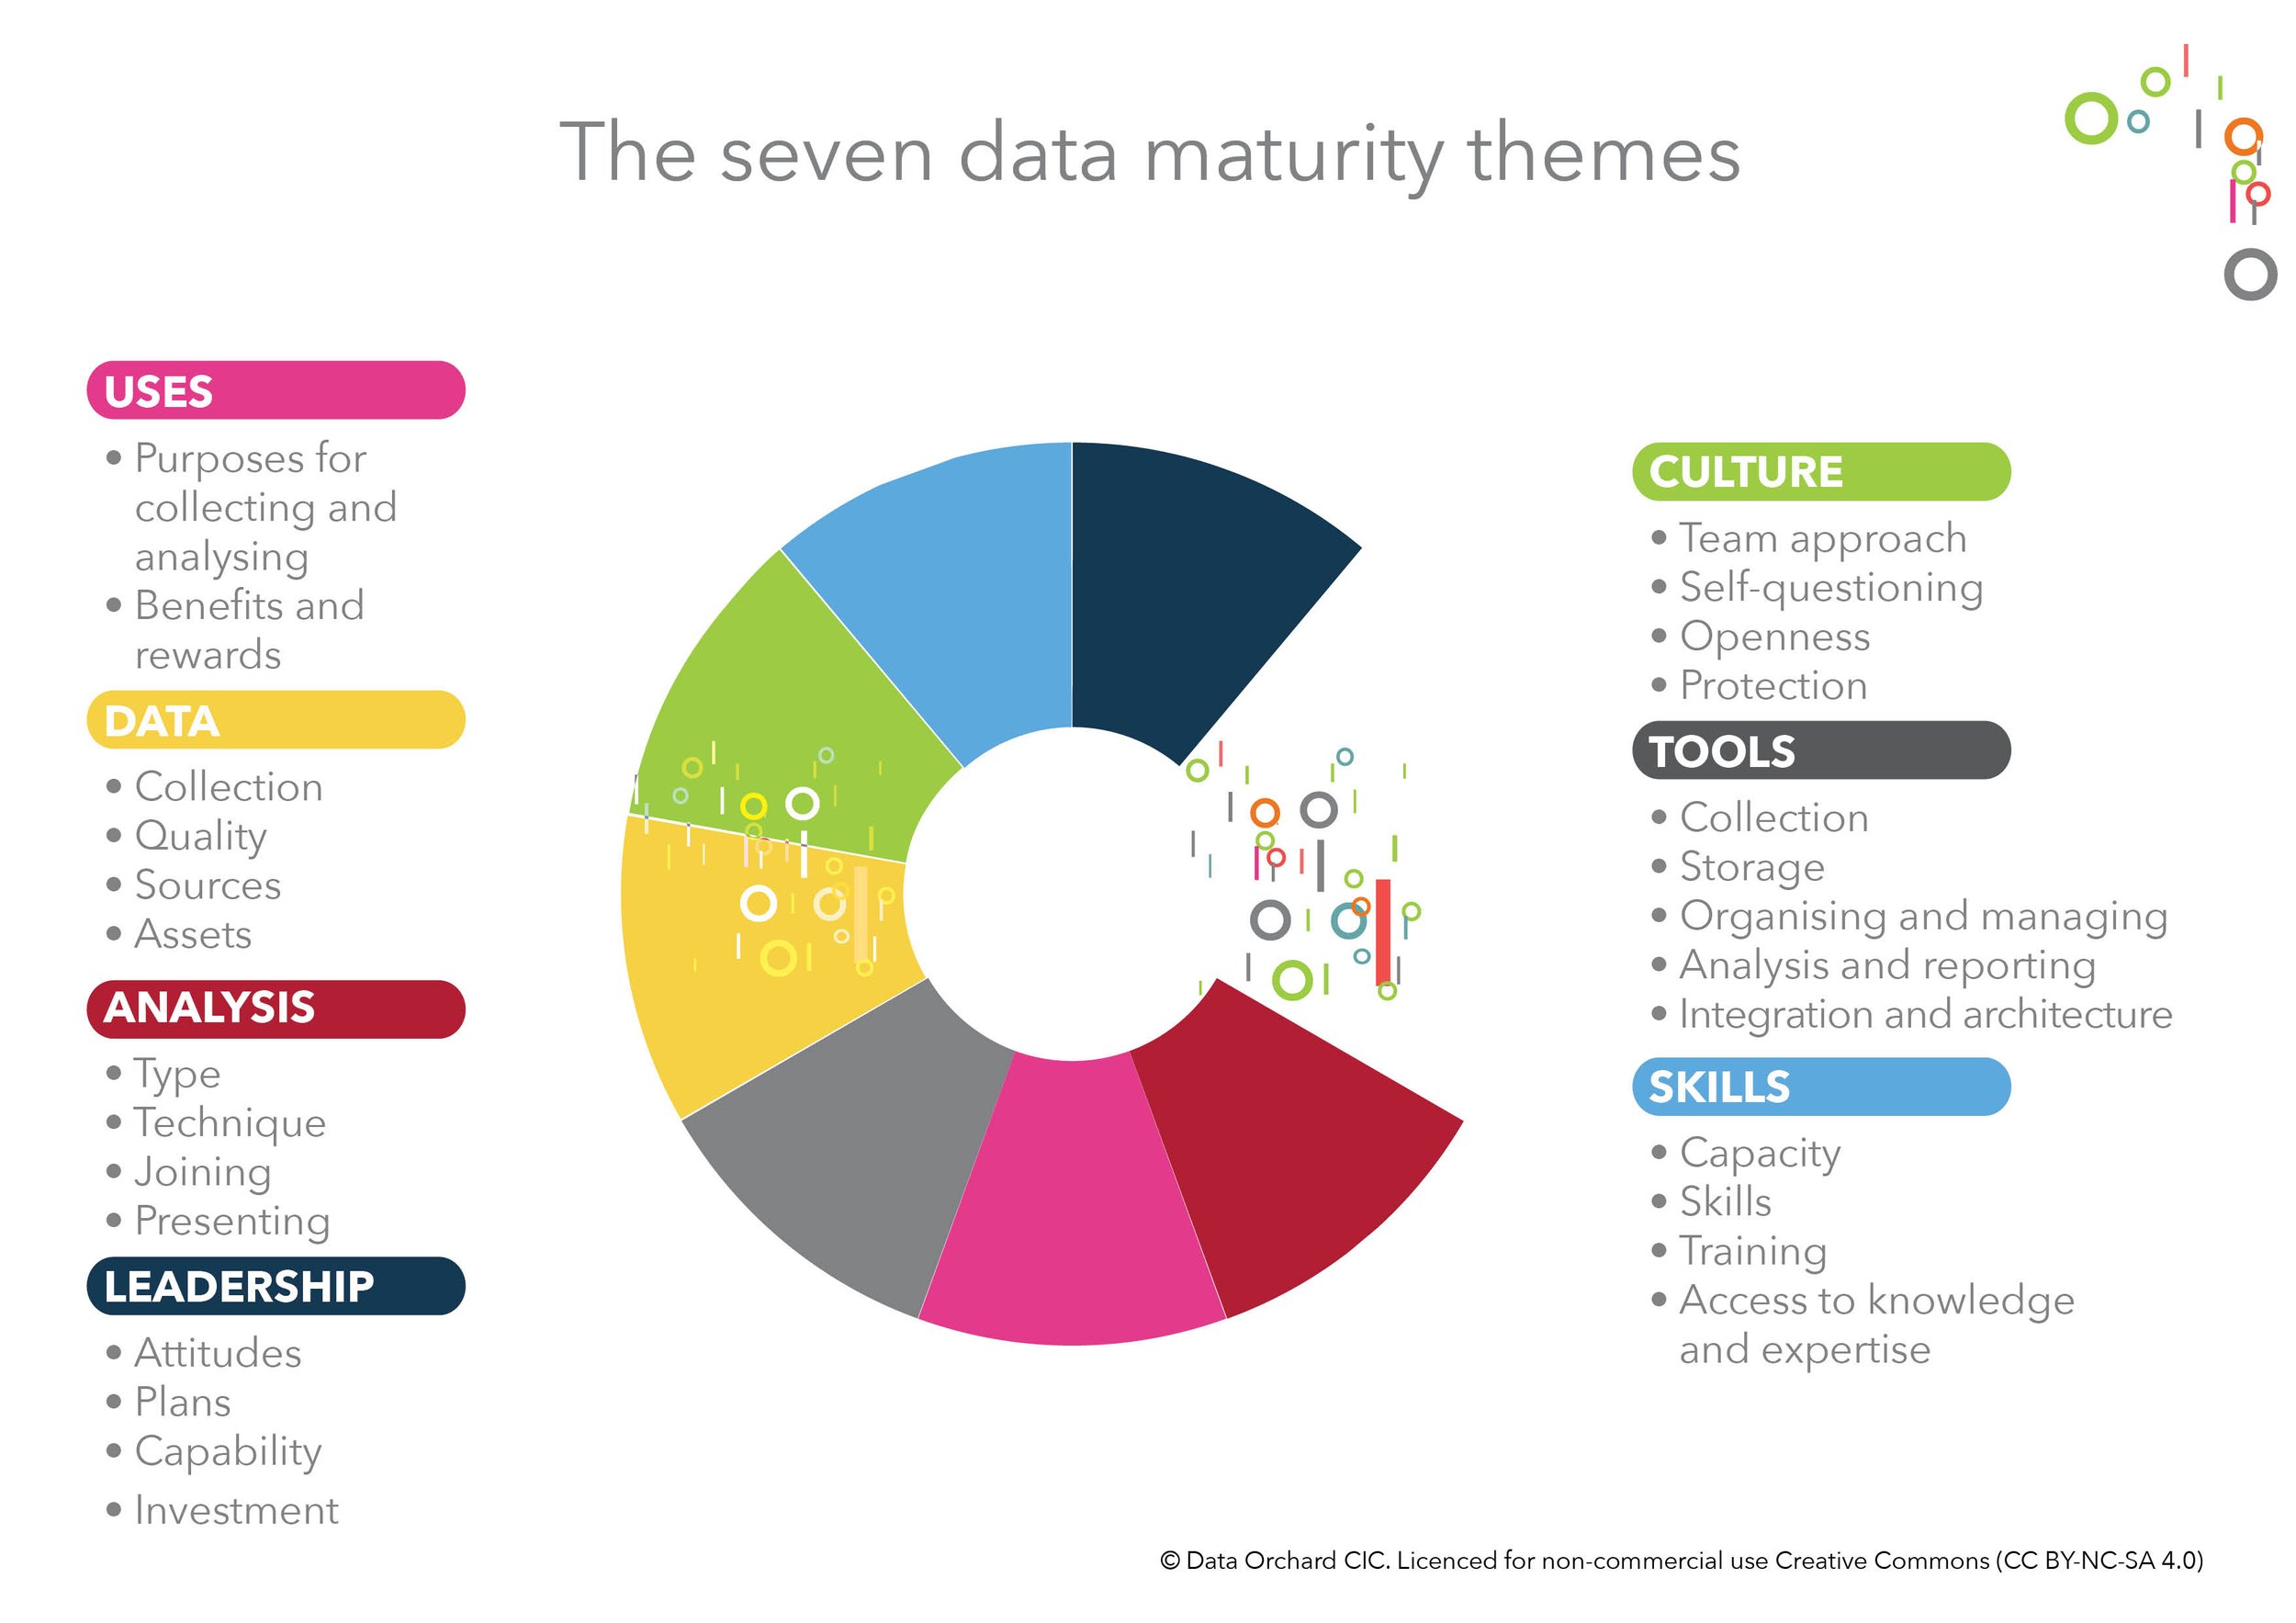
We’ve created a framework model which describes data maturity on a five-stage journey. This progresses from ‘Unaware’ through to ‘Mastering’ across seven key themes: Uses, Data, Analysis, Leadership, Culture, Tools, and Skills.
The framework is available for non-commercial use, licensed under Creative Commons Licence CC BY-NC-SA 4.0, and can be downloaded here dataorchard.org.uk/resources/data-maturity-framework

The online Data Maturity Assessment involves users answering a series of questions related to each of the seven themes described in the chart below.
At the end of the assessment users receive a report with their results. The report identifies:
where their organisation is on the five-stage journey
how they score in each of the seven themes
where their strengths are
priority areas to focus on.
In addition, users can:
compare how they’re doing with the sector through benchmarks
explore more about their current and next stage for each theme.
A sample Data Maturity Assessment report is shown on the next page (and online here). You can drill into each theme to find out more about your score and current/next stages).
Essentially the measurement in our Data Maturity Assessment tool works by: scoring questions; weighting questions; grouping the weighted scored questions by theme and taking an average of these to give an overall theme score; and averaging the seven theme scores to give a data maturity stage (based on a scale of 0 to 5 for Unaware through to Mastering).
All questions are normalised so that before weighting they contribute equally to the relevant theme and themes are normalised so that they contribute equally to the overall score for an individual organisation. Each question is assigned a weight: standard, high, or very high based on how important responses will be in determining important features or behaviours of data maturity.
Benchmarking enables comparison between one organisation and a number of others. For the benchmarking in this report, we use the organisation level score for all questions, themes, and stages. Further information on scoring, weighting, and benchmarking is available here.

The source data for this report comes from users of the online Data Maturity Assessment. The raw dataset for users between 1 January and 31 December 2021 included 1,221 responses.
It should be emphasized that Data Orchard’s Data Maturity Assessment tool is a self-assessment tool. The results reflect what users say about data in their organisations. Users are self-selecting. Whilst we can make no claims about it being precisely representative of the sector, we do monitor the profile of users to see how representative they are.
The Data Maturity Assessment was specifically designed to encourage and enable multiple people from the same organisation to take the assessment. This is in part to develop and share learning and understanding, to create a common language, and to mobilise people into thinking collectively about planning and action towards future improvements. Critically though it’s about recognising that data is used, understood, and applied in different ways by different people in different parts of an organisation. So, to shift the whole organisation forward it is sensible to involve all those people and perspectives in the assessment process. There are two main versions of the Data Maturity Assessment: the individual version and the organisational version.
The individual version of the assessment is designed for one person to complete. This version is available for free. It is suitable for very small organisations. Sometimes the assessment is completed together by a group, sometimes several people take the individual assessment separately and discuss their individual results together.

The whole organisation version of the assessment is designed for multiple users to complete. This version is customisable and available on a tiered pricing basis. Notably many of those using the organisational version invite large numbers of staff (sometimes all of them) to take part in the assessment. For simplicity we have illustrated in the graphic below how the process works for three users.

In addition to our full assessment (which includes standard questions for both the individual and organisational versions) we also have ‘taster assessment’. This is a cut-down version of the full assessment and takes around 5 minutes rather than the full 20 minutes to complete. Around 15% of the validated users have completed the taster without going on to take the fuller assessment.
For most of the analysis in this report we focus only on organisations completing the full assessment. However, in Annex 1 where we explore individual questions in more detail, we also include 52 not-for-profit organisations that took the taster for the questions that appear in both the taster and full assessment.
We excluded users using apparently personal email addresses (such as gmail or yahoo) or where the email address provided was not valid. Where users provided organisational addresses, we sought to confirm that the organisation existed. For UK organisations we accessed public registers such as Companies Houses, the Charity Commissions for the different parts of the UK, and the FCA Mutuals Register. For organisations apparently based outside of the UK or where we could not identify them on a UK register, we relied on information provided on their public website.
After cleaning and validation, the dataset used for this report included 1,007 complete unique responses (of either the taster or full assessment). Where respondents completed both a taster and full assessment, we used only the full assessment data to avoid duplication.
In total the number of validated organisations using the tool during this period was 220. For UK based charities and companies, we identified the sector, type, age, turnover, location, and number of employees from the aforementioned publicly available records.

At a sector level we are interested in understanding the data maturity of whole organisations. In most cases (around two thirds) a single response has been recorded for the organisation. Usually this is a single person on behalf of the organisation, though we know from our 2022 impact evaluation that it is not uncommon for multiple people to complete the assessment together as a group, especially in smaller organisations.

Over a third of organisations have had multiple users complete the assessment, and in some cases in large numbers. Where there have been multiple respondents from the same organisation, the respondents’ scores for each question have been calculated, combined and averaged to give a single organisational score.
As part of our data preparation process, we needed to be quite specific about how we defined the not-for-profit sector. This is a well-known challenge to data people trying to describe sectors. A full list of the legal types included in each category is included in Annex 2.
In summary all validated organisations were grouped in four broad sectors based on their legal type as follows:
NGO (non-governmental organisations) – Trusts, charities, social enterprises, charitable incorporated organisations, constituted non-governmental organisations with a social mission.
Public sector – local, regional, national government, education, health.
University
Commercial – public and private limited companies.
We defined the not-for-profit sector to essentially mean non-commercial organisations and included the first three on the above list: NGO, public sector, and university.
This term refers to the people the organisation serves. We acknowledge different organisations may have different names for this e.g. service users, beneficiaries, customers, residents, members, participants, stakeholders, and students. They may serve other organisations or communities. It’s possible the organisation works for the benefit of the environment or creatures e.g. natural habitats, birds, or animals.
This term refers to the people who work for the organisation. It includes employees and volunteers. In some cases, it may also include freelancers, associates or contractors who work to deliver the organisation's services and products to clients.
The tool is being used primarily by the sector for which it was designed i.e. non-governmental organisations (NGOs). We know from our 2022 impact analysis that many private sector consultancies also use the tool in their work with clients (some of which are in the not-for-profit sector). It also continues to be used by other non-commercial organisations including a range of public sector bodies and universities.

The profile of organisations by type of activity were many and varied. In the not-for-profit sector the numbers were highest for health, social services, local government, and education sub-sectors.

The organisations using the tool in 2021 came from over 30 countries around the world. Most of the not-for-profit users were from the UK. Internationally organisations that used the tool most were from Canada, USA and Australia.

Focusing just on the not-for-profit sector organisations, and more specifically those in the UK, we can see users came from every UK nation and region.

Based on what we know about income, the data suggests most not-for-profit sector users are medium (£100,000–£1M), large (£1M–£10M), or major (£10M–£100M) with a few super-major sized (£100M+) (using the NCVO sector definitions). For many it was not possible to find income data. Small charities may be among these or the many we were unable to validate (i.e. if they were using a personal rather than organisational email address).

Again, there is a lot of missing data on the numbers of employees for organisations using the tool. The data we have suggests users are of all different sizes with those with 100+ staff being the largest groups.

The available data suggests the kinds of organisations taking a data maturity assessment tend to be more established. Start-ups and younger organisations may well have other priorities as they are at an earlier stage of development, and perhaps might not have accumulated so much data either.

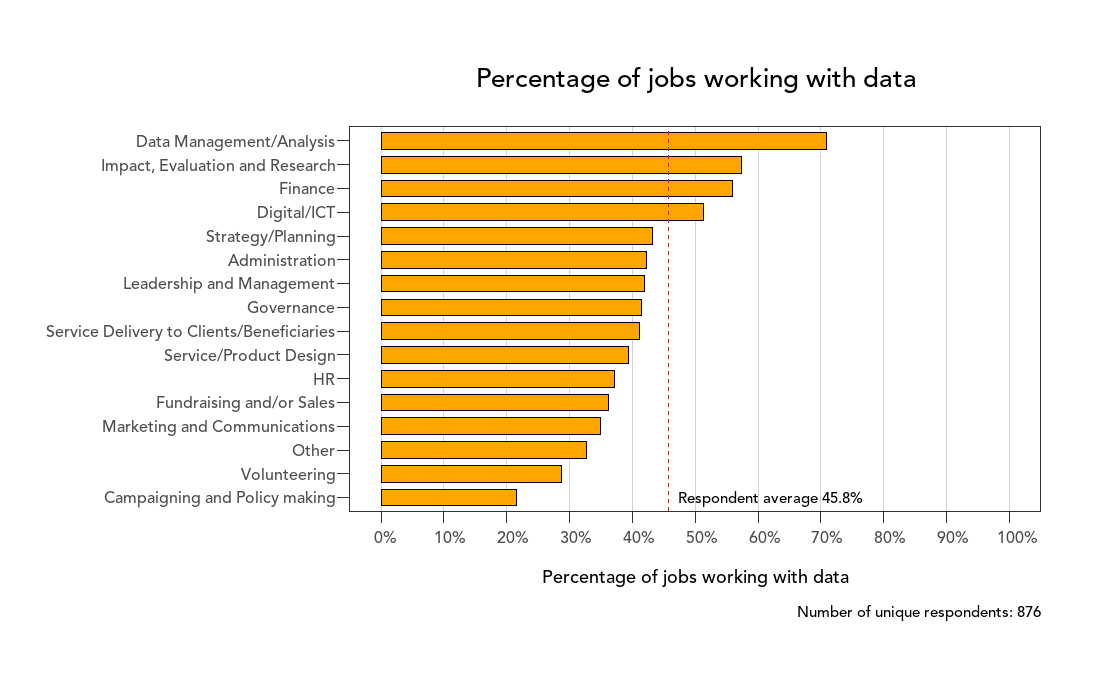
The top job roles of not-for-profit sector people using the tool are in ‘strategy/planning’ and ‘leadership and management’. Unsurprisingly there are also many users in data management and analysis roles. A similar number describe themselves as being in service delivery roles. We note it is common, especially in smaller organisations, for people to have multiple roles and for there to be no dedicated responsibility for data. Meanwhile in large/major/super major organisations there may be whole analytics departments.

Based on the not-for-profit organisations completing the full Data Maturity Assessment, most organisations are at the ‘Learning’ stage (50%). A good proportion have progressed into ‘Developing’ (37%), though barely any have made it to the ‘Mastering’ stage. Around one in ten are lagging in the ‘Emerging’ stage (11%).

There were none that scored overall at the ‘Unaware’ stage. To some extent this is unsurprising given users are self-selecting and data unaware organisations are unlikely to search for a tool to help them self-assess where they are. However, it should be noted at theme level many organisations do score in the unaware stage.
Based on the users of our tool in 2021, our analysis suggests there’s little difference in data maturity across the sectors and sub-sectors. Averages (medians) suggest organisations are typically at the ‘Learning’ stage whatever sector they operate in. However, averages hide the wide variation in scores which shows there are leaders and laggers in all sectors.

Overall, across the not-for-profit sector there’s not much difference between the themes. The average (median) scores range from 2.66 to 2.91 out of 5 across the seven key themes: Uses, Data, Analysis, Leadership, Culture, Tools, and Skills.

The sector’s strongest themes were:
Data (2.91 out of 5)
Culture (2.9 out of 5)
Tools (2.89 out of 5)
Leadership (2.87 out of 5)
The three weakest themes were:
Skills (2.66 out of 5)
Analysis (2.67 out of 5)
Uses (2.74 out of 5)
Again, the averages hide much of the variation in the scores. In the chart below each dot represents a score for an organisation on each of the themes. It illustrates how widely the scores vary for all seven themes.

Our early research into data maturity identified that it was a combination of the seven key themes that enabled organisations to advance their data maturity. In this research we have tested this by looking at correlations. Correlations, which are measured on a scale of -1 to +1, measure the strength of a relationship between two variables. They can either be positive (where they increase or decrease together) or negative (where as one increases the other decreases). The findings show there are positive correlations between all the data maturity themes so a low or high score in one will predict a low or high score in another, though some relationships are much stronger than others. The three strongest and most significant correlations all involve ‘Culture’:
Culture and Leadership
Culture and Data
Culture and Skills.
Meanwhile the three least significantly correlated themes all involved ‘Tools’:
Tools and Analysis
Tools and Leadership
Tools and Data.
Correlation demonstrates the strength of a relationship but does explain what’s causing it. For more detail about the correlations analysis see Annex 4.
We know from this research (and from the 2020 results) that staff spend a lot of time working with data. Even without the costs of tools, staff report on average 46% of their time goes into collecting, managing, and reporting data. Obviously, this varies. In data management and analysis roles higher rates would be expected, however the findings show data is part of almost everyone’s job whatever their role.
At an organisational level we wanted to explore whether staff in more data mature organisations spent more, less, or the same amount of time as less mature organisations. Where there were multiple respondents for an organisation we took an average. The results show the percentage of time increases as the level of data maturity increases, though since there are only two organisations at the ‘Mastering’ stage it’s best to focus on those at Emerging, Learning and Developing stages.

The data suggests more mature organisations reap greater rewards and benefits, both in the delivery of services and products and their internal capabilities, than less mature organisations (see section 5.1 on uses and Annex 3). However, it appears the average percentage of staff time spent working with data also increases by data maturity stage. Excluding 'Mastering' due to there being only two organisations, there are sufficient numbers in the remaining three categories to show a significant increase.
We have found no relationship between an organisation’s income level and its data maturity. This concurs with findings from earlier rounds of analysis exploring this. Based on the data we have; higher income charities are no more data mature than lower income charities. See Annex 5 for more detailed analysis by income.

The set of 141 not-for-profit organisations that took a data maturity assessment in 2021 are, except for 10 cases, a completely different set of organisations to the 133 we analysed in 2020. A growing number of organisations are taking repeat assessments to see whether they have progressed on their data maturity journeys hence the 10 cases. A separate research project is underway tracking these journeys.
Comparing organisational data maturity in 2021 with 2020 shows there’s little overall difference in the median scores for those taking the assessment. This is positive in that it confirms and validates the findings in our previous analysis. A closer comparison across the range shows there were fewer in the ‘Emerging’ stage than previously.


Comparing across themes also confirms there is little difference between the two groups of not-for-profit organisations.

This section provides an overview of the findings for each of the seven key themes: Uses, Data, Analysis, Leadership, Culture, Tools, and Skills. More detailed analysis is provided in Annex 1.
The ‘Uses’ theme explores the:
purposes for which organisations use data, and the
benefits and rewards reaped from doing so.
These are considered in two contexts:
how an organisation applies the use of data in its delivery of products and services to clients
how data is used in ‘running and driving the business’, i.e its internal capabilities.
The average (median) score for the ‘Uses’ theme is 2.74 out of 5. Overall, most organisations are at the ‘Learning’ stage, though a good proportion have progressed to the ‘Developing’ stage and a few even into ‘Mastering’.

Most organisations are not using data to its full potential, though the rewards and benefits are more extensive as organisations mature. See Annex 3 for more detailed analysis.
In relation to services the primary purpose is for capturing and recording activities with clients (86% do this moderately or extensively). Just under half, 49% are using data for monitoring service quality and performance. Far fewer are using it to any real extent for targeting services, supporting reach and engagement, design and delivery of services and products, and measuring the difference they make in terms of client outcomes.
For the 16 organisations at the ‘Emerging’ stage, there are no extensive rewards and benefits reported. The three areas where data has moderate influence on services are.
Evidencing needs/problems the organisation seeks to address (20%)
Evidencing impact to stakeholders (13%)
Design and delivery of services and products (6%).
For the 71 organisations at the ‘Learning’ stage, there are six areas where data has influence on services. These rewards and benefits are reported to be both extensive and moderate as follows:
Evidencing needs/problems the organisation seeks to address (34%)
Evidencing impact to stakeholders (39%)
Design and delivery of services and products (39%)
Reach/engagement with clients (38%)
Targeting of services/interventions to clients (30%)
Client/environmental outcomes (23%).
For the 52 organisations at the ‘Developing’ stage, the rewards and benefits are much more extensive across the six areas where data has influence on services. These organisations report extensive and moderate benefits as follows
Evidencing needs/problems the organisation seeks to address (62%)
Evidencing impact to stakeholders (53%)
Design and delivery of services and products (49%)
Reach/engagement with clients (51%)
Targeting of services/interventions to clients (61%)
Client/environmental outcomes (47%).
In relation to internal capabilities around running and driving the organisation, the primary purpose for using data is for compliance reporting. 63% say they use data moderately or extensively for regulator/funder/contract reporting.
Over half say they use data for strategic planning and decision making (54% moderately or extensively). However fewer than 40% see any meaningful benefits in areas like learning and evaluating what they do, improving service and product design, raising income, and influencing external policy and decision makers. Again, the rewards and benefits are considerably different depending on which stage of data maturity organisations are at.
For the 16 organisations at the ‘Emerging’ stage, there are no extensive rewards and benefits reported. The five areas where data has moderate influence on internal capabilities are.
Strategic planning and decision making (13%)
Income generation (fundraising, sales, contracts) (13%)
Levels of knowledge and expertise (13%)
Credibility and influence (13%)
Strength of partnerships (7%).
For the 71 organisations at the ‘Learning’ stage, there are seven areas where data has influence on internal capabilities. Additional areas where data is influencing the organisation include ‘Improving Impact’ and ‘Efficiency savings’. Rewards and benefits are reported to be both extensive and moderate as follows:
Strategic planning and decision making (35%)
Income generation (fundraising, sales, contracts) (31%)
Levels of knowledge and expertise (22%)
Credibility and influence (24%)
Improving impact (20%)
Strength of partnerships (18%)
Efficiency savings (resources, processes, service/product design) (18%).
For the 52 organisations at the ‘Developing’ stage, the rewards and benefits are much more extensive across the seven areas where data has influence on internal capabilities. These organisations report extensive and moderate benefits as follows:
Strategic planning and decision making (58%)
Income generation (fundraising, sales, contracts) (47%)
Levels of knowledge and expertise (55%)
Credibility and influence (51%)
Improving impact (56%)
Strength of partnerships (55%)
Efficiency savings (resources, processes, service/product design) (35%).
The data theme explores four key subthemes:
Collection
Quality
Sources
Assets
The average (median) score for the ‘Data’ theme is 2.91 out of 5. This is the theme where the sector scored strongest overall with almost half scoring in the developing and even mastering stages.

Many organisations don’t know what data assets they have, who looks after them, or what state they are in. Just over a quarter maintain a record of data assets and who’s responsible for them.
Three in five say they collect the right data. A third say they collect it in consistent and efficient ways. When it comes to data quality there’s a very mixed picture. Only 30% say their data is complete, accurate and, where necessary, kept up to date. Of these hardly any, fewer than 4%, are very confident about the quality of their data. Less than half say they know the quality of the data they collect.
The sector makes fairly good use of data available from external sources. 70% use publicly available external research (e.g. government or academic) either regularly or occasionally. A good proportion (63%) commission their own research and evaluation, and half use shared measures and benchmarks with other organisations.
Data versatility, where the same data can be used and re-used for many different purposes, remains out of reach for many. This suggests data is often being collected for a single purpose, project, or team. 42% have rich data they can use and re-use for different internal and external stakeholders.
The analysis theme explores four key subthemes:
Type
Technique
Joining
Presenting
The average (median) score for analysis is 2.67 out of 5. Most organisations are at the ‘Learning’ stage. Many have progressed into the ‘Developing’ stage and a handful are beginning the ‘Mastering’ stage.

Just under half say they analyse data in meaningful and useful ways. Most organisations are doing basic counts and charts (91%), some of which may include manual/visual approaches (over half say they do this moderately or extensively). This would align with the use of paper forms and questionnaires to collect data (40% moderately or extensively). Analysis of historic data is also widespread with 88% using descriptive analysis to summarise averages and past trends.
Deeper analysis around causes, patterns, differences, and correlations are used by 54%. More advanced predictive and prescriptive types of analytics are even less common, used by 29% and 22% respectively.
Self-questioning and experimental analysis are also relatively rare. Less than a third say they use data to explore and test assumptions about the difference their organisation makes or run pilots or trials to explore how best to act in the future.
Bringing data together to provide a strategic overview is a challenge for most. More than a quarter say they either don’t bring their data together at all or people verbally report on it. Most commonly data is manually collated in reports from different sources (43%). Those slightly more advanced use a mixture of manual and partially automated approaches (26%). Around 1 in 20 do this in a fully automated way.
The leadership theme explores four key subthemes
Attitudes
Plans
Capability
Investment
The average (median) score is 2.87 out of 5, with this theme showing the widest range of responses overall. Most are in the ‘Learning’ and ‘Developing’ stages though there are almost as many in the ‘Unaware’ stage as there are in ‘Mastering’.

Almost all organisations say their leadership knows data is important. Less than 1% say their leadership is not interested in data at all. Despite this, 63% say their leadership is not convinced about its value. Just 6% say their leadership plans and prioritises data as a vital resource and understands how to use it to improve what the organisation does.
When it comes to data informed decision making hardly any (2%) are using past, present, and forward-looking data to support this. 9% say leadership don’t use data for decision making at all.
Across the board, the results suggest most organisations are at least ‘thinking’ they should have a plan for improvement with data. Just 5% say there’s no plan and no intention to make one. At the other end of the spectrum one in twenty have a regular cycle of data planning, implementation, and review. Most of those using the Data Maturity Assessment tool are actively creating a plan or intending to.
Planning around data is closely related to business planning more generally. 40% say their organisation has an overarching business plan with defined, measurable goals. Of those with a business plan three-quarters say data and analytics is a major organisational priority.
Leadership skills and investment remain a weakness. Over half say they don’t have people with data analytics expertise within their leadership (53%). Only a quarter say leaders invest enough in data related resources: people, skills, learning and tools.
The Culture theme explores four key subthemes:
Team approach
Self-questioning
Openness
Protection
For ‘Culture’, the sector is at the upper end of the ‘Learning’ stage with a large proportion already in the ‘Developing’ stage. The average (median) score for culture is 2.9 out of 5. This is overall the second strongest data maturity theme after ‘Data’.

Almost all organisations say they share data internally (88%), though less than a quarter say data is easily available and accessible to staff when they need it. Moreover, just because data is shared doesn’t mean it’s actually used by intended audiences e.g. only 36% say people in different teams/levels of seniority regularly discuss data and how to act on it. Presentation and communication of data is likely to be an issue also. Less than one in three agree they present and communicate data in accessible ways to different audiences.
Opinions are divided when it comes to using data internally to ask difficult questions and challenge practices. 33% say their organisation is comfortable with this, though 47% say they are not.
There is quite a lot of data sharing externally. 69% share data with partners, networks, and stakeholders; 59% share data with clients; and 53% openly publish their own data and analysis. Note these practices tend to be more occasional than regular and the same question remains about whether it is being used and acted upon.
Despite the introduction of the new data protection legislation in 2018 (including GDPR), there’s a mixed picture around policies and practices for security and protection. Whilst 70% say they specify and manage access to sensitive and personal data, less than two-thirds (62%) say their policies and practices are robust to ensure data is safeguarded. In addition, less than half (43%) monitor and test potential risks to improve their data security and protection.
The tools theme explores five key subthemes:
Collection
Storage
Organising and managing
Analysis and reporting
Integration and architecture
The average (median) score for tools is 2.89 out of 5 with most in the ‘Learning’ stage, a good proportion in the ‘Developing’ stage and a few reaching ‘Mastering’. Curiously this is the only theme where no organisations scored themselves at the ‘Unaware’ stage.

Organisations use a wide range of tools for collecting, storing, analysing, and reporting data. However more than half don’t think their tools are very good, especially when it comes to enabling them to bring together, analyse and report data.
Just under half say they have good tools for collecting data, yet only one in three say their organisation collects data in consistent and efficient ways. Databases/CRM systems, websites, and online surveys feature most strongly among the digital tools for collecting data. However, it’s notable that non-digital approaches (i.e. the use of paper forms and questionnaires) remain widespread. 40% say they collect data from clients and stakeholders on paper either moderately or extensively.
Centralised and cloud-based tools for physically storing and managing data are widespread (used by 82% and 74% respectively). Yet less than two thirds (62%) say their files and documents are centrally and securely stored. Meanwhile, just one in three say their digital files and documents are well organised and managed. This aligns with the finding that only 27% organisations say staff can easily search for and find the information they need.
Two in five say they have good tools for analysing data. Whilst a wide range of tools are used, spreadsheets are the most universal of all (87% use spreadsheets moderately or extensively). Database/CRM’s, finance software and survey tools are quite common (58%, 53% and 47% respectively). More advanced business intelligence tools less so (30%), and advanced specialist data science tools least of all (20%).
When it comes to integration and architecture just 25% of organisations say they have good tools for joining and relating data from various sources. One in three say they don’t think about integration between tools when purchasing new products.
The skills theme explores four key subthemes:
Capacity
Skills
Training
Access to knowledge and expertise
The sector average (median) for skills is 2.7 out of 5. It is the weakest theme overall. Most organisations are at the ‘Learning’ stage with some promising numbers shifting into ‘Developing’ and even ‘Mastering’.

A key finding around skills is that people don’t know what they don’t know, and don’t feel they have access to trustworthy support and advice. 38% say they understand their needs around data skills and capabilities. Only one in four say they have access to external data and analytics support and advice from experts they trust.
The range of skills is complex and most don’t think they have the right skills to maximise their use of data (just 21% say they do). One aspect many do tend to focus on is data protection. 58% say their staff receive induction and regular training on data protection and security. Though this suggests a fair proportion (over 40%) could be vulnerable in this respect.
More broadly, fewer than one in five say staff are data literate, over half lack data analytics skills at leadership level, and less than a quarter say they have enough capacity to manage and develop their organisation’s data capabilities.
Based on the analysis on overall data maturity and exploration of the seven key themes, we have drawn seven key insights from this research. These are:
The not-for-profit sector is still learning about data.
A lack of data skills remains a major weakness for not-for-profits.
Not-for-profit leaders aren’t making data-informed decisions.
Not-for-profits would gain more from focusing on their culture, rather than tools.
Data maturity takes time and effort, but the rewards are worth it.
Data maturity isn’t…and is… about the money.
Organisations aren't taking advantage of digital tools to make data work for their cause.
2021 data shows most not-for-profit organisations to be at the ‘Learning’ stage (50%) in their journey to data maturity. A good proportion have progressed into ‘Developing’ (37%), though barely any have made it to the ‘Mastering’ stage. Around one in ten are still lagging in the ‘Emerging’ stage (11%). Average (median) scores for all the key themes (Uses, Data, Analysis, Leadership, Culture, Tools, and Skills) were all in the ‘Learning’ stage, ranging from 2.66 to 2.91 out of 5.
Skills is the weakest area for not-for-profits. The range of skills, knowledge and experience around data and analytics, and the types of roles and responsibilities are many and varied. A major obstacle is people not knowing what skills and capabilities they need, nor where they can access trustworthy advice and support.
While almost all organisations say their leadership think data is important, just 6% think leaders actually prioritise data as a vital resource and understand how to use it. Organisations have lots of data, but only 2% feel their leadership are actually using that data to make data-informed decision. This could be due to a lack of data skills in leadership teams – many (53%) say that there is no one with data analytics expertise within their leadership. It may also be due to barriers accessing meaningful insights from disparate data sources.
Our research has repeatedly found that all seven key themes have a positive correlation with an organisation’s data maturity. But, some relationships are stronger than others. The strongest and most significant correlations all involve the culture of an organisation – issues around behaviours, policies and practices, relating to team approach, self-questioning, openness and protection. The weakest correlations all involve tools. So, while databases and relationship management systems are important for holding data, organisations that really want to advance their data maturity would do well to focus on their culture first.
Staff spend a lot of time working with data, whatever the data maturity of the organisation, suggesting the hidden cost of data is high for all organisations. Organisations that are less data mature, however, see very little reward for all this time and effort. As data maturity advances, organisations do invest more time in data, but proportionally, the rewards and benefits grow at a much faster rate. For example, compared to an organisation at ‘Learning’ stage, a ‘Developing’ organisation increases its average time spent on data by 7%, but increases its ability to use data to evidence the need and problems they are addressing by almost 30%.
Organisations with greater income are not inherently more data mature than those with lower incomes. However, those that invest in data related resources i.e. people, skills, training, and tools, are more advanced.
Much was made of the need to digitise during the pandemic but, while some gains have been made, in many cases there hasn’t been as much progress as you might think. A lot of data is still on paper (40% collect data on paper moderately or extensively - 14% less than in 2020, but still a high proportion). When it comes to tools for analysing and reporting data, spreadsheets still dominate, but databases and CRMs are fairly common (60%). Business intelligence tools are used by 30%, and 20% are using more advanced and specialist data science tools (up from 15% in 2020).
Since this is the second report of its kind, and the results validate the findings from 2020, we can be more confident about how authoritatively the results describe the reality of data maturity in the not-for-profit sector.
The number of validated users is still small, though cumulatively our dataset now exceeds 500 organisations since the launch of the assessment tool in October 2019.
The results illustrate the range of different stages of data maturity across the sector. There are a few pioneers at the forefront, edging into ‘Mastering’. Most are still ‘Learning’ and an encouraging proportion, over a third, are at the more advanced ‘Developing’ stage. Around one in ten are lagging in the ‘Emerging’ stage.
Perhaps the most important finding is that the sector is already investing so much of its precious resource (people time) in data with such differing degrees of reward and benefit. For the first time we’ve been able to illustrate how few the rewards for low data maturity organisations and how great they are for those with higher data maturity.
Skills remain the biggest weakness. The lack of data skills in the sector has been known for almost a decade (Marsh Skills and Leadership Review 2013). Given the revolutionary advances in digital data and analytics since then, it is unsurprising there’s still so much work to be done to catch up. What’s perhaps most challenging is the diversity of skills needed: collectors, curators, organisers, cleaners, analysts, communicators, thinkers, challengers, protectors, sharers, ethicists, technologists, visionaries, realists… organisations need them all. The ODI data skills framework is an interesting context around which to consider the evolving jobs market in the sector.
We will continue to monitor, with interest, the change over time particularly in relation to confidence, practices, changing behaviours and the extent of rewards and benefits, i.e. the shift from ‘somewhat agree’ to ‘strongly agree’, from ‘moderately’ to ‘extensively’, and from ‘occasionally’ to ‘regularly’.
As you would expect of an organisation specialising in data, the findings, feedback from users, and experience of producing the analysis have influenced a range of changes and improvements. These include our: tool design, theoretical model, data model, validation processes and analytical approaches. In doing so we continue our own cycle of learning and improvement.
Overarchingly, we see this research as another step in evidencing the ‘problem space’ and support needs of the not-for-profit sector in relation to data. We are delighted to be part of a diverse and growing network of peers and partners both in the UK and internationally with a shared interest in building the data capabilities of the sector.
Our message to policy makers and decision makers interested in strengthening the not-for-profit sector is to invest in building knowledge and skills around data. For organisations involved in educating and skilling people for the future, we encourage you to develop courses and pathways into the not-for-profit sector for the whole plethora of growing skills roles. We particularly encourage those supporting the development of leadership skills to embrace data as a core resource and responsibility in running any organisation.
For not-for-profit sector organisations we encourage you to undertake a Data Maturity Assessment (or a repeat Data Maturity Assessment) as a way of enabling staff to learn about data and catalysing action to improve.
We at Data Orchard are encouraged to be part of a growing number of support providers helping not-for-profits get better with data. Collaboration is one of our core values and so we’ve been delighted the Data Maturity Assessment tool has been of value to other specialists and consultants working in this space. Our growing community of not-for-profit sector data people is one way we can enable more people to learn and support each other.
Meanwhile sector infrastructure organisations and networks have a broader role in promoting and leading data maturity for their memberships. We see cohort approaches to advancing data maturity are already showing benefits and the potential to expand these further will be a great opportunity for scaling and accelerating progress.
We published our first state of the sector Data Maturity report in 2021 (based on the initial data generated in 2019 and 2020). Since then, we’ve continued to invest time and resources in maintenance and improvements with a focus on making the Data Maturity Assessment tool financially sustainable.
Some of our achievements since our first report have been:
Creation of the Data Maturity Hub with a range of educational tools and resources, case studies and stories about real-life journeys and rewards of data maturity in the sector.
Widespread promotion of the tool via events, blogs, and social media to raise awareness about data maturity among leaders, networks, support providers and infrastructure organisations working to build the data capabilities of the not-for-profit sector.
Creation of the resource pack with everything an organisation needs to engage and communicate with staff when undertaking an organisation data maturity assessment.
Investment in advanced and customised reporting, repeat assessment and cohort assessment products to enable data maturity to be assessed over time and at scale.
Publication in January 2022 of a new version of the Data Maturity Framework (v2.1).
Publication of our 2022 Data Maturity Assessment Impact Report, and this, our second State of the Sector Data Maturity Report for data collected in 2021.
More in-depth analysis to explore questions and hypotheses following the first research.
Our primary focus will be to continue to ensure the financial sustainability and quality of the assessment tool:
User test new features for customised results dashboards.
Develop and user test advanced benchmarking features.
Produce another State of the Sector Data Maturity Report for data collected in 2022.
Engage more people and organisations in researching and knowledge sharing around data maturity.
We would encourage all readers of this report to give feedback, ask questions and get involved in discussions. In addition:
For people working in not-for-profit organisations:
If you haven’t already done so, do take the Data Maturity Assessment. It’s available in free and premium versions.
Share this report and encourage other organisations in the sector to take the assessment too.
For consultants, volunteers, agencies and partners supporting the not-for-profit sector:
Please feel free to use and share the free Data Maturity Assessment tool with your clients.
Get in touch if you’d like to discuss partnering for discounted pricing on the premium version for individual assessments, repeat assessments, and/or cohort assessments.
For infrastructure organisations, networks and membership groups:
Please share this report and the Data Maturity Assessment tool with your members and networks.
Get in touch to discuss conducting a data maturity assessment at scale for a specific geography, sub-sector or group of organisations.